
Bohr’s Atomic Model: Explaining Hydrogen's Atomic Spectrum
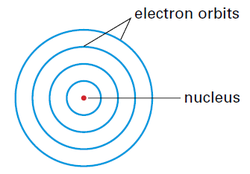
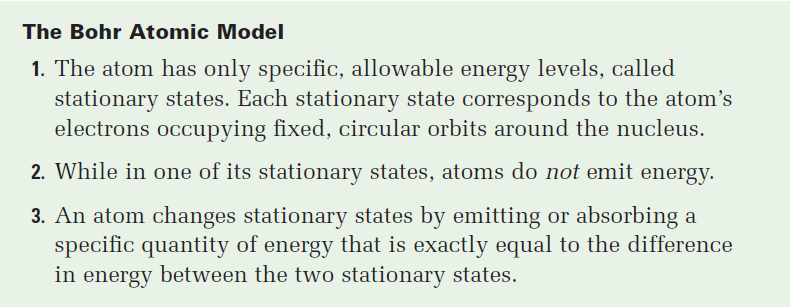
If you haven’t done so, please read the key points of Bohr’s atomic model (found in the previous post).
Bohr is applying the new ideas of quanta in his model, proposing that the energy that is emitted and absorbed by an atom must have specific values. The change in energy when an electron jumps from one energy level to another is not continuous. Rather, it’s quantized.
Bohr is applying the new ideas of quanta in his model, proposing that the energy that is emitted and absorbed by an atom must have specific values. The change in energy when an electron jumps from one energy level to another is not continuous. Rather, it’s quantized.
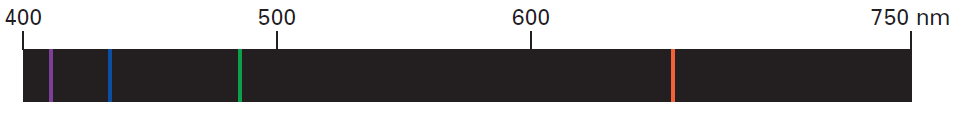
Look at the line spectrum for hydrogen above. The energy that is associated with the colored lines in this spectrum corresponds to the change in energy of an electron as it moves to a higher level and back.
Example
When a hydrogen atom is exposed to electrical current, or another form of EM energy, its electron absorbs photons of energy. The atom is now said to be in an excited state.
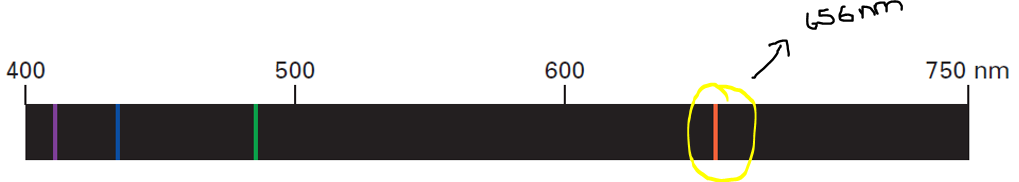
When the electron of a hydrogen atom that has been excited to the 3rd energy level falls to the 2nd energy level, it emits light of certain energy. Specifically, an electron that makes a transition from the 3rd energy level to 2nd energy level emits a photon of red light with a wavelength of 656 nm.
Example
When a hydrogen atom is exposed to electrical current, or another form of EM energy, its electron absorbs photons of energy. The atom is now said to be in an excited state.
When the electron of a hydrogen atom that has been excited to the 3rd energy level falls to the 2nd energy level, it emits light of certain energy. Specifically, an electron that makes a transition from the 3rd energy level to 2nd energy level emits a photon of red light with a wavelength of 656 nm.
Because line spectra result when atoms in an excited state emit photons as they fall to a lower energy level, these spectra are also called emission spectra.
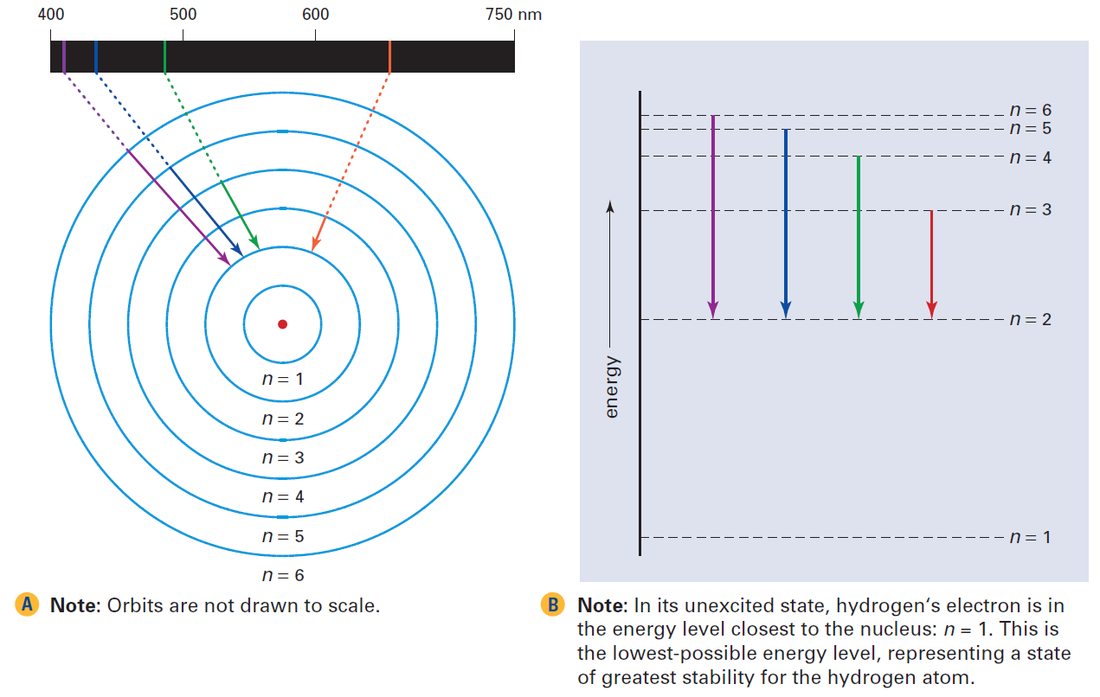
How the Bohr model explains the coloured lines in hydrogen’s emission spectrum. When an excited electron falls from a higher energy level to a lower energy level (shown by the downward-pointing arrows), it emits a photon with a specific wavelength that corresponds to one of the coloured lines in the spectrum.
The image above shows the energy transitions that are responsible for the colored lines in hydrogen’s emission spectrum. The symbol, n, is used to designate the allowed energy levels for the hydrogen atom:

This symbol, n, represents a positive integer {1, 2, 3 ...} and is called a quantum number.
Absorption Spectrum
Another kind of spectrum that is related to an atom’s emission spectrum is an absorption spectrum. This kind of spectrum results when electrons of atoms absorb photons of certain wavelengths, and so are excited from lower energy levels to higher energy levels.
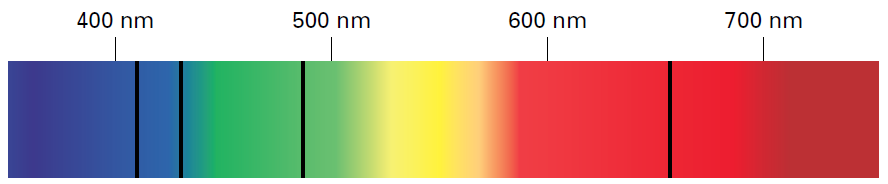
When light passes through gaseous hydrogen atoms, the electrons in the hydrogen atoms absorb photons of red, green, blue, and purple light at specific wavelengths. When the electrons return to lower energy levels, they re-emit photons with these same wavelengths. However, most of the photons are emitted in a different direction from the one in which the electrons absorbed the light. As a result, dark lines appear in the spectrum where photons of those particular wavelengths are absent.
As you can see above, discrete and dark lines appear in the precise locations (wavelengths) as those of the colored lines in hydrogen’s emission spectrum.
The Success and Limitations of the Bohr Atomic Model
The success of Bohr’s model was in showing the quantization of atomic energy – that electrons are restricted to specific energy levels (orbits). His model successfully predicted the colored lines in the visible-light portion of hydrogen’s emission spectrum. The model also predicted other lines that earlier chemists had discovered in the UV-infrared portions of hydrogen’s emission spectrum.

The ultraviolet series of lines appear as a result of electrons falling from higher energy levels to n = 1. The infrared lines appear as a result of electrons falling from higher energy levels to n = 3.
The problems with Bohr’s model, however, became apparent when it was unable to predict/explain the emission spectra produced by atoms with 2 or more electrons (i.e. it could predict the emission spectra for He+, Li 2+, and Be 3+).
It was clear that either Bohr’s model was a coincidence (so Bohr got lucky) or it was an oversimplification in need of modification (needed more work).
It was clear that either Bohr’s model was a coincidence (so Bohr got lucky) or it was an oversimplification in need of modification (needed more work).

 RSS Feed
